Initially, think of your data analyses as falling into one of three categories:
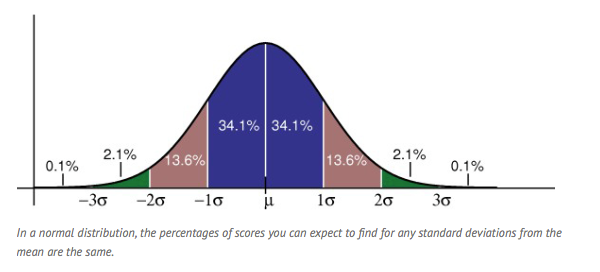
#1 Descriptive Statistics where you provide information on the responses for each question considered as a whole. Here you will use numeric statistics (e.g. mean, standard deviation, outliers) and graphic displays (e.g. histograms, bar charts) to communicate how your population responded. Your desciptions should go beyond simply noting the means but should include a thorough examination of "what you found”. Think about how you will characterize your data in the report. Consider comparing “ segments” of your population where you look at outlier responses more closely or compare the upper quartile to the lower quartile etc. portions of your population All students will be required to incorporate some histograms in your final paper.
EXCEL SKILLS REQUIRED: Create histogram chart and calculate “Desciptive Statististics" using Statistical Toolpak. Students will also need to calculate first quartile (Q1, 25th percentile), third quartile (Q3, 75th percentile), interquartile range (IQR), and margin of error (MOE, “ Confidence" 95%).
#2 Comparative Statistics with foundational source measures of central tendency, outliers and percentile rank.
2a) Where idenitcal questions were asked in your study and statistics for these questions were available in the foundational source, the means can be used to compare the “typical” responses for these two populations. Differences between your study’s mean and the foundational source’s mean are statistically significant if the difference is at least 2X the Margin of Error (MOE). These pairs of findings can be labeled as “statistically significant”. Where differences are less than 2X, a further statistical test will be applied known as a test of significance. This family of procedures will be taught to ALL students in the first two weeks of the spring semester.
2b) Where idenitcal questions were not asked in your study and/or statistics for these questions were not available in the foundational source, you will need to limit your analyses to broader non-numeric comparisons. Think of drawing a numeric breakpoint to compare the % of respondents above/below a threshold you determine (eg “27% of the foundational source reported strong and very strong agreement with XXXX while my study found 45% reported a strong or very strong agreement”).
EXCEL SKILLS REQUIRED: Use appropriate T-test formula to calculate the p-value for each question's comparison of a foundational source and your study responses. These conditional probabilities will allow you to infer” which differences are statistically significant and which are likely attributable to chance. The p-value calculates the probability that the difference is attributable to mere chance associated with random selection.
#3 Correlational Statistics where you examine “relationships” between the responses for each of the quantitive response questions. Remember correlation does not establish causation. Think of correlation as providing you an objective method for grouping your questions for examination. Establishing which questions tended to solicit similarly high responses (positive correlation) or contrary responses (negative correlation). Interpreting correlations in academic literature can be trocky and involve statistics above your abilities. Mr. Nelson can help determine specific guidelines for you interpretations but you can begin with the following interpretive chart.
Correlation: Must be between -1.0 and +1.0.
Strong Positive Correlation .80 to 1.00
Moderate Positive Correlation .60 to .80
Slight Positive Correlation .30 to .60
Virtually No Correlation -.30 to .30
Slight Negative Correlation -.30 to -.60
Moderate Negative Correlation -.80 to -.60
Strong Negative Correlation -1.00 to -.80
Basic Overview of Categorical Data - Displaying & Describing Categorical Data
Basic Explanation of Statistical Inference
Sampling Survey Vocabulary - Mr. Nelson’s List
Sample Histogram For Findings Section - Better than verbally describing data distributions.