Stock Returns During Presidential Election Years
Stock Returns During Presidential Election Years
Investopedia, “What is Intrinsic Value"
Investopedia, "Market Value of Equity (Market Capitalization)”
Investopedia, "Required Rate of Return"
Investopedia, "Dividend Discount Model"
Investopedia, “Residual Income Method”
Investopedia, “Discounted Cash Flow Model”
REVIEW EXCEL FINANCIAL FUNCTIONS FOR RETIREMENT
Investopedia, “Bottom Line Growth Versus Top Line Growth"
Investopedia BETA Overview Reading
KW Site: “CASE STUDY” - Meet the Client
Investopedia, “Affluent Millenial Investor Survey” - Know Your Client
KW Approved Stock List - Investment Restrictions
KW Investment Rules - More Restrictions
Investopedia, Education, Investing, Stocks - Historical Rate of Return Context
Investopedia, Education, Investing, Alternate Investments
Investopedia, “Efficient Frontier"
Investopedia, “Active Versus Passive Investing"
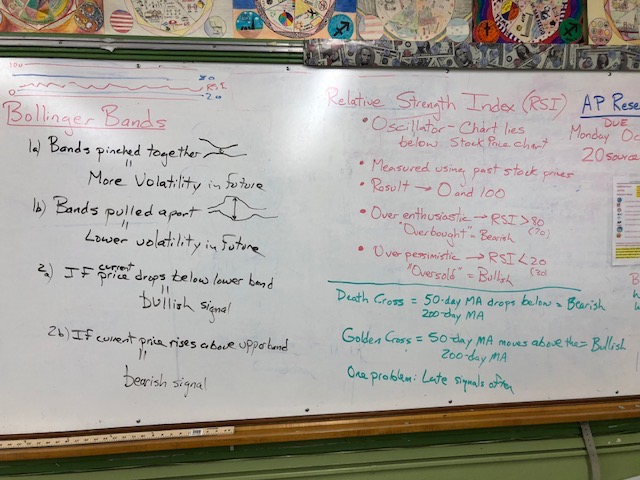
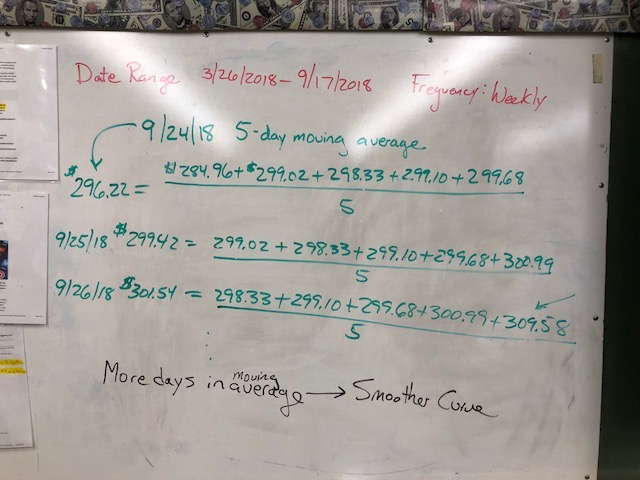
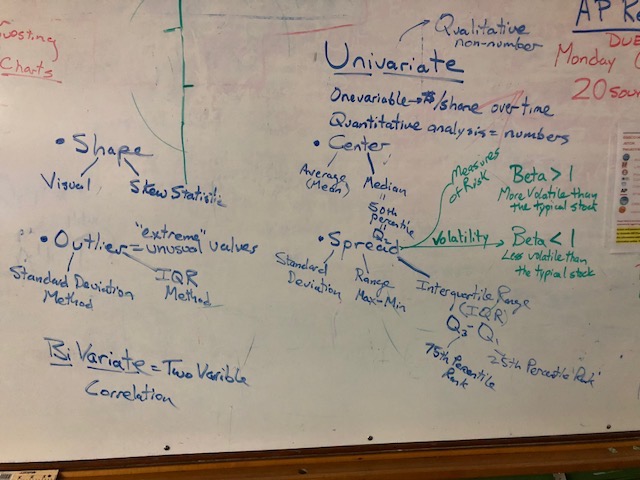
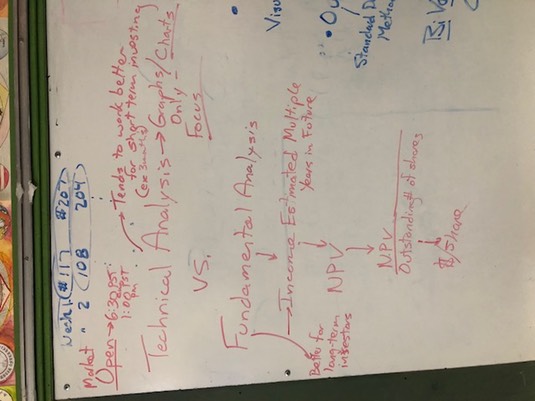
Board Notes for Stock Market Data Analysis Unit (October 2018)
Practice Laddering File - Courtesy Brandon, Dakota, _____, and ________
Practice Laddering File - Loa, Feldman, Ly, and Lee
A special thank you to the SIFMA organization whose generous grant allows our Business Statistic students to play SMG at no cost. Further materials are available in Resources: Financial Literacy.
DECA SMG COMPETITION (One Hour To Beome A Stock Expert)
Cramer Video "Know What You Own” Video (10 minutes, focus on 4:00-8:30 minute marks) **
Understanding Statistics Video (2 minutes) **
Rate of Return Video (1 minute 41 seconds) **
Net Present Value Explained Video (2 minutes 1 second) **
Internal Rate of Return Explained Video (1 minute 30 seconds) **
Capital Budgeting: NPV vs. IRR Video (Advanced, 1 minute 30 seconds)
Using Excel To Calculate IRR Video (1 minute 36 seconds)
Volume of Shares Traded Explained (1 minute 43 seconds)
Using Volume To Make Purchase Decisions (1 minute 49 seconds)
Analysis of Variance Explained Video (1 minute 22 seconds)
Downside Risk (1 minute 17 seconds) **
Standard Deviation Explained Video (1 minute 52 seconds) **
Empirical Rule (1 minute 33seconds) **
Volatility & Beta Explained Video (1 minute 22 seconds) ** Examine Beta For Your Stocks
Correlation (2 minutes, 2 seconds) **
Correlation Coefficient (1 minute 26 seconds) ** - Calculate “r" Using SPDR TRACKER
Implied Volatility Video (Adavnaced Topic - 1 minutes 9 seconds)
Normal Distribution Explained Video (1 minute, 13 seconds)**
Skewness Explained Video (58 seconds)**
Moving Averages Explained Video (1 minute 34 seconds) **
Jim Cramer Explains Golden Crosses Video (10 minutes, focus first 4 minutes) *
Candlestick Charts Explained Video (1 minute 47 seconds) **
Bollinger Bands Video Explanation Video (2 Minutes) **
Bollinger Explains The Value Of His Bands Video (3 minutes)
Bollinger Bands Text Explanation
Stochastic Oscillator Video (1 minute 47 seconds)
Relative Strength Indicator (RSI) Video (1 minute 22 seconds)
Regression Analysis Overview Video (1 minute 21 seconds)
R-squared Applied To Stocks Video (1 minute 58 seconds)
American Depositary Receipt (ADR (1 minute, 57 seconds)
Khan Academy Videos - “Finance & Capital Markets” Section
"Put and call options” offers a series of 18 videos of varying levels of depth. The first ten offer a basic understanding of options and their purpose, strengths and weaknesses as financial instruments.
"Forward and Futures Contracts” - The first four videos in this section explain the basic mechanics of future contracts.
Portfolio Ideas
Our Starting Point Review
Why Learn To Invest?
Retirement Planning Made Simple
What's My Number?
** http://www.youtube.com/watch?v=CNufQG0gc9M
** http://www.youtube.com/watch?v=IHHkpjV27iU
**Investco Intentional Investing
** Hot Dog Loan
Introductory Stock Videos
Cramer Video "Know What You Own"
Cramer Video "How Many Stocks Do You Own"
YAHOO! Data Mining With Permission
Video Showing How To Download Historical Stock Price Data
Stock Market Game Materials
Stock Market Game Log In Window
Select Sector SPDR Website: Select Sector SPDRs are exchange traded funds (ETFs) that divide the S&P 500 into nine sector index funds. Together, the nine Select Sector SPDRs represent the S&P 500 as a whole. Each Select Sector SPDR can be bought individually, providing investors with undiluted exposure to a particular sector or industry group. Their web site allows students to research the stock market as a whole, by sector or by individual company.
FYI: Each Select Sector Index is calculated using a modified "market capitalization" methodology. This formula ensures that each of the component stocks within a Select Sector Index is represented in a proportion consistent with its percentage of the total market cap of that particular index.
StockCharts.Com: This free stock analysis tool allows students to graph stock prices over time. Students synthesize their prior knowledge of graphs with the financial literacy curriculum of this course. Students use this site to develop graphical displays to predict the future movement of stock prices in the short and intermediate term. Students are introduced to graphical displays beyond standard line graphs. Stockcharts.com explains candlesticks in this hand-out.
Investopedia Forex & Stock Trading Library: Chart Patterns
CNBC Stock Screener This search engine identifies stocks that meet certain statistical characteristics. There are preset screens that meet certain statistical parameters; "Solid Stocks, Solid Companies", "S&P Dogs", "High Quality, High Dividends", "Small Cap Value" and "Large Cap Growth". Users may also customize their own set of search parameters.
Ameritrade Fund Comparison Tool : This search engine allows users to input an index ticker symbol, and the engine outputs a chart that compares five similar funds with the input fund.
Motley Fool: You've got to love any financial resource with such a self-depricating domain, fool.com. These guys were one of the first resources that attempted to educate the average investor in terms they could understand. Originally, they communicated through a radio show and monthly newsletter. Now they disseminate ther lessons through the web and social media.
Passion For Your Portfolio - CNN show clips
Jim Cramer Explains Golden Crosses: Description pending …. To develop their understanding of intermediate stock price predictors, students choose a stock and use stockcharts.com to create a time series price chart for three years. Students then annotate all golden and death crosses. An annotated evaluation is added to stating whether the intermediate term price predictor was correct.
Understanding The Logarithmic Scale
Cyclical Phases: Peak-trough tables produced by the BLS Current Employment Statistics (CES) program identify key turning points in seasonally adjusted CES time series. Key turning points are those which mark the beginning of sustained periods of growth or contraction in the time series. These points mark changes in trend and are distinct from month-to-month or other short-term fluctuations.
Win $5,000 for College: Take the Fifth Third Bank Financial Literacy Challenge
