Working With Big Data
Tableau Software Promotional Video
Visualize Big Data in Your Apache Hive Through Excel
Use "Explore In-Depth" To Create & Visualize "Hot Searches"
See "Crowdnetics" In Big Data & Business That Employs A Similar Application In Stock Selection (Screenshot Below )
Read how to Wildcard Search, Inflection Search, Case Sensitive Search,
List of Part-Of-Speech Tags (eg roots, nouns, adjectives etc), Compositions
Ngram Viewer Data Download Instructions
David McCandless' "Google Ngram Viewer Experiments"
Infographics & Art
**David McCandless' Information Is Beautiful
Hungry Planet Infographic: Biting Off More Than We Can Chew
**David McCandless of Oxford Discusses Design Literacy
Storytelling With Infographics
**Larry Ferlazzo's Collection Of "The Best" Lists On Infographics
Ten Tips For Designing Inforgraphics
Courses & Certificate Programs
**Big Data In Education (Columbia University On-line Course)
UCI Extension Certificate Program Predictive Analytics Educational Planning
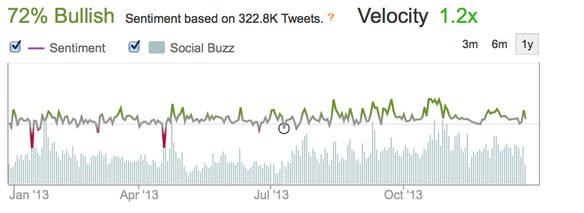
Example of Crowdnetics That Measures "Sentiment" For Stocks
** Personal Favorites